To measure the performance of an instance or a server CPU, I do several things.
After I create the instance I block the Firewall, so no one trying to discover vulnerabilities or playing with other’s servers can deviate the tests by overloading the CPU.
I htop to be sure that the server is between 0% and 2% CPU usage. After I ensured that, I do two tests. One, I note the result, and another a bit later, I note the result and compare to be sure that are accurate and no process caused a deviation.
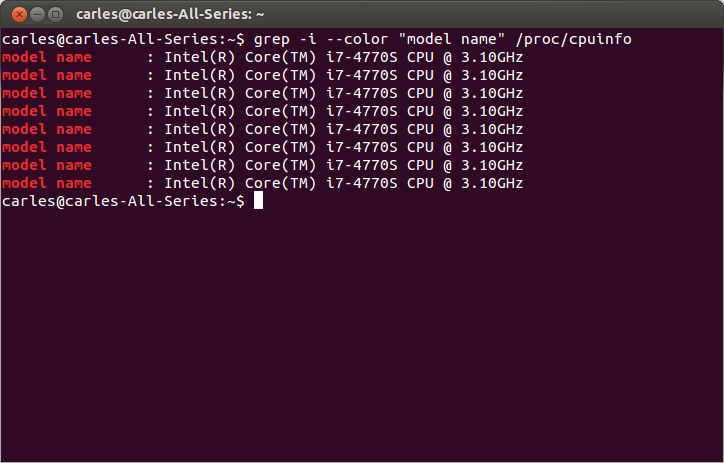
To see the model of the CPU in the host I run the command:
grep -i --color "model name" /proc/cpuinfo
I note this info with the number of cores provided by htop.
I monitor and have more much info, like the time that take to start an instance, size of the disk, price per hour, position relative in performance to that provider’s offer… but I do not provide all this information by the moment in the web page.
Other cool indicators are speed to write/read to disk, outboud bandwidth pipe allowed per instance size, price per extra Gigabyte, if inbound packets are charged also, speed in connection to the same Lan instances (Gigabit, 10 Gigabit, etcetera), latency to Europe and US…
To register disk write speed I use random data and big files with this dd command:
dd if=/dev/urandom of=cmips-speed-test.000 bs=1024 count=5000000
